Comparison in the SSU tRF profiles obtained experimentally with DNA from the Dünnwald soil and predicted from the sequence information in the TReFID results list.
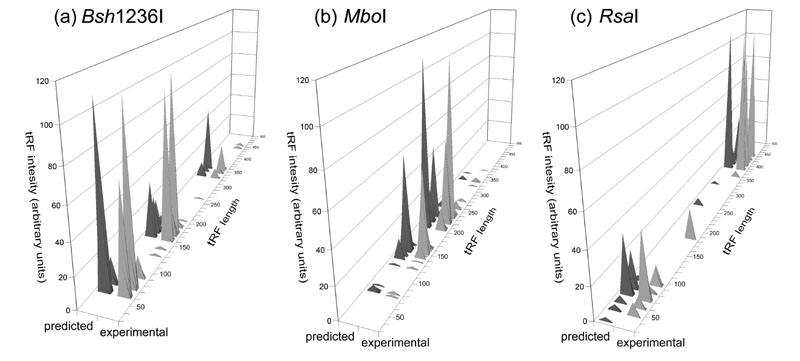
DNA was isolated from the Dünnwald soil sample, and the tRF lengths were determined experimentally. By using the polygons construction from the tRFs of all 13 restriction enzymes, a list of bacteria in the Dünnwald soil could be compiled which are closely related to organisms with entries in the TReFID databank. The tRFs of these closest relatives in the databank were then taken to construct the predicted tRF profile of the DNA from the Dünnwald soil.